
GrafanaでCPU使用率等を可視化するために事前準備としてPrometheusをインストールしていきます。
以前の記事(Grafana(8.2.2)のインストールからDataSource(DB)を使うまで)の続きみたいなもの。
環境
- CentOS7
- Prometheus 2.31.1
- node exporter 1.2.2
ダウンロード
まずは必要なファイルをダウンロードします。展開場所はどこでもいいですが今回は/usr/local配下にします。
Prometheusダウンロードページ:https://prometheus.io/download/
# cd /home/test/grafana/prometheus
# wget https://github.com/prometheus/prometheus/releases/download/v2.31.1/prometheus-2.31.1.linux-amd64.tar.gz
# wget https://github.com/prometheus/node_exporter/releases/download/v1.2.2/node_exporter-1.2.2.linux-amd64.tar.gz
# tar xvfz prometheus-2.31.1.linux-amd64.tar.gz
# tar xvfz node_exporter-1.2.2.linux-amd64.tar.gz
# mv prometheus-2.31.1.linux-amd64 /usr/local/
# mv node_exporter-1.2.2.linux-amd64 /usr/local/
systemd ユニットファイル作成
systemctlで起動停止するためにPrometheusとnode exporter両方のユニットファイルを作成します。
# vi /etc/systemd/system/prometheus.service

[Unit]
Description=Prometheus
After=syslog.target network.target

[Service]
Type=simple

ExecStart=/usr/local/prometheus-2.31.1.linux-amd64/prometheus --config.file=/usr/local/prometheus-2.31.1.linux-amd64/prometheus.yml
ExecStop=/bin/kill -INT $MAINPID

[Install]
WantedBy=multi-user.target


# vi /etc/systemd/system/node_exporter.service

[Unit]
Description=node exporter
After=syslog.target network.target

[Service]
Type=simple

ExecStart=/usr/local/node_exporter-1.2.2.linux-amd64/node_exporter
ExecStop=/bin/kill -INT $MAINPID

[Install]
WantedBy=multi-user.target
起動できるか確認します。
statusでエラーが出ていないことを確認してください。
# systemctl start prometheus.service
# systemctl status prometheus.service
# systemctl start node_exporter.service
# systemctl status node_exporter.service
Prometheus設定
Prometheusとnode exporterを連携させるためprometheus.ymlに設定します。
scrape_configsに”- job_name: ‘node'”以下を全て追加してください。
# vi /usr/local/prometheus-2.31.1.linux-amd64/prometheus.yml

scrape_configs:
  # The job name is added as a label `job=<job_name>` to any timeseries scraped from this config.
  - job_name: "prometheus"

    # metrics_path defaults to '/metrics'
    # scheme defaults to 'http'.

    static_configs:
      - targets: ["localhost:9090"]
  - job_name: 'node'
    static_configs:
      - targets: ["localhost:9100"]
追加後、systemctl restart prometheus.service で再起動します。
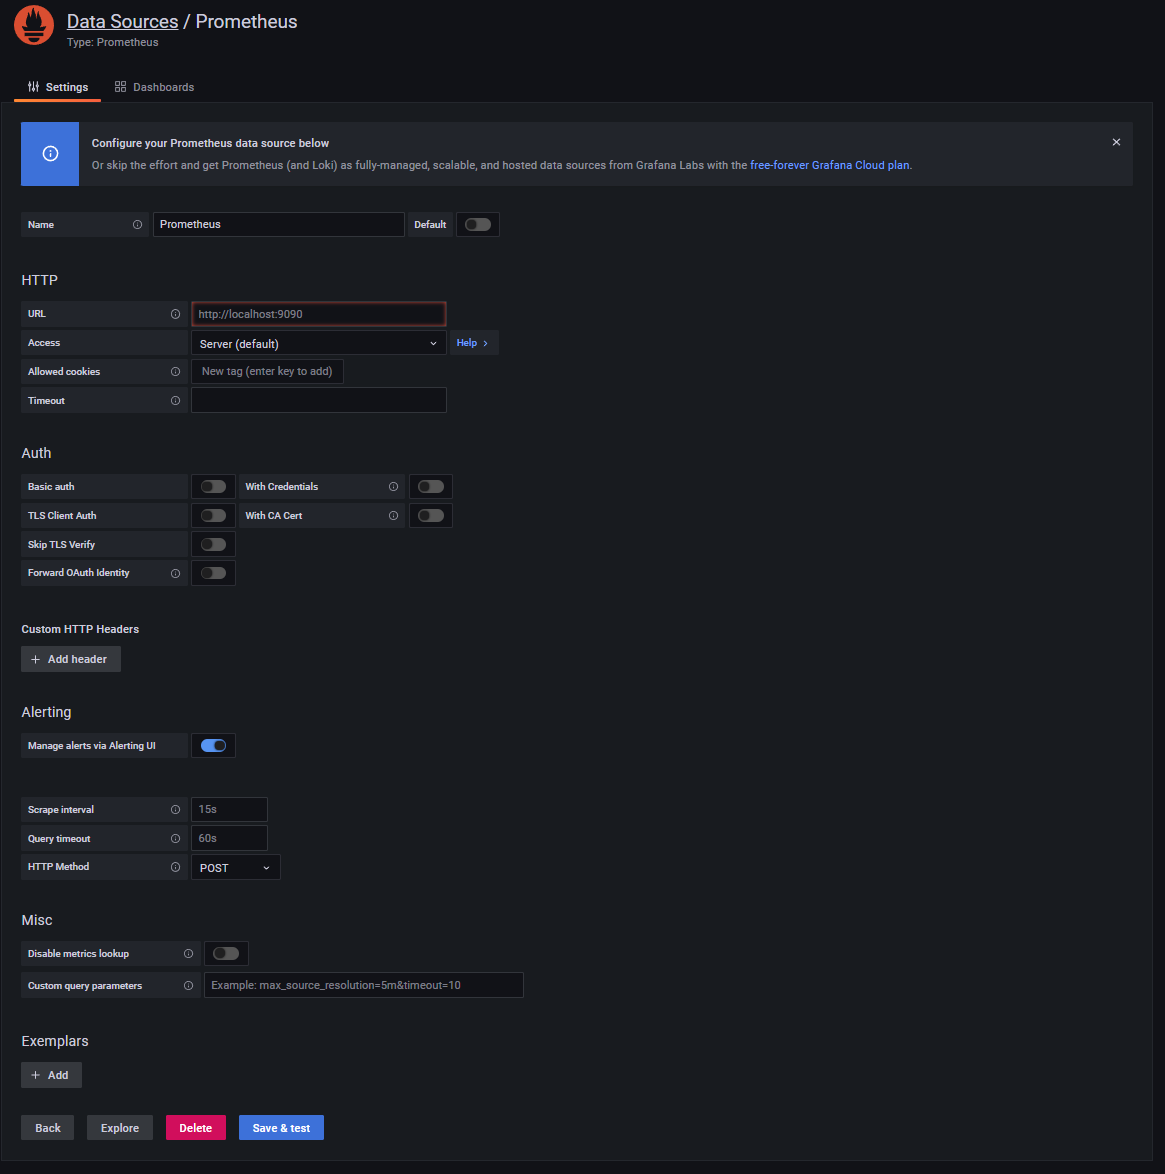
# systemctl restart prometheus.serviceこれで準備完了です。本当ならPrometheusはhttp://localhost:9090/ 、node exporterはhttp://localhost:9100/ にアクセスして画面を表示したいところですが作業しているサーバがGUI環境なしのためここではスキップします。
同じような環境の方でどうしても確認したいなら9090ポートを開ける、もしくはApacheに設定を追加してアクセスしてください。あとはwgetとかcurlとかでアクセスしてみるのも良いかもしれませんね。私は面倒なのでしません。
とりあえずPrometheusのインストールと設定は完了したので次はGrafanaで表示していきたいと思います。
以上です。

コメント